Configuring line chart generation
-
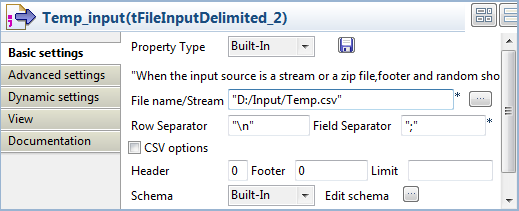
Double-click the second tFileInputDelimited component, which is labelled Temp_Input, to display its Basic settings view.
-
Fill in the File name field with the path
to the temporary input file generated by the tFileOutputDelimited components. In this use case, the
temporary input file to the tLineChart is
Temp.csv. -
Double-click the tLineChart component to
display its Basic settings view.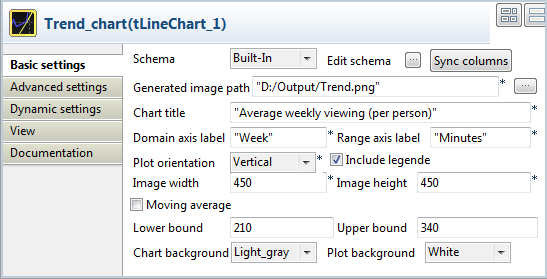
-
Click Edit schema to open the schema
dialog box.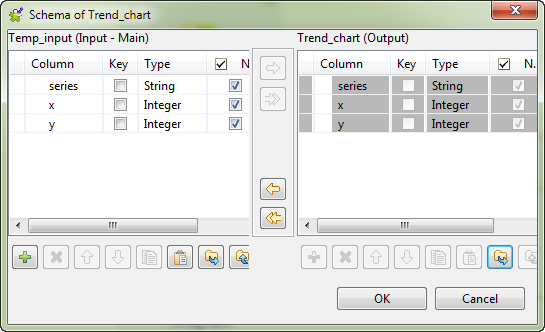
-
Check that the input and output schemas are synchronized. If needed, copy
all the columns from the output schema to the input schema by clicking the
left-pointing double arrow button. Then, click OK to close the schema dialog box. -
In the Generated image path field, define
the path of the image file to be generated. -
In the Chart title field, define a title
for the line chart. In this use case, enterAverage Weekly Viewingas the chart title.
(per person) -
Define the domain (X) and range (Y) axis labels. In this use case, enter
WeekandMinutesrespectively the axis
labels. -
Define the image size, the moving average period, the lower and upper
bounds, the chart background color, and the background color of the plot
area, as you prefer.In this use case, we set the image size to450by
450, set the lower and upper bounds to210and
340respectively, select light
gray as the chart background color, and keep the rest
settings are they are.
Document get from Talend https://help.talend.com
Thank you for watching.
Subscribe
Login
0 Comments