Adapting the source data to the tLineChart schema
-
Double-click the tMap to open the
Map Editor.You can see an input table on the input panel, row1 in this example, and three empty output tables, named
TV_A, TV_B, and TV_C on the
output panel. -
Use the Schema editor to add three
columns to each output table: series (string),
x (integer), and y
(integer). -
In the relevant Expression field of the
output tables, enter the text to be presented in the legend area of the line
chart,TV A,TV B, andTV C
respectively in this example. -
Drop the Week column of the input table onto the
x column of each output table. -
Drop the Mins_TVA column of the input table onto the
y column of the TV_A table.
-
Drop the Mins_TVB column of the input table onto the
y column of the TV_B table.
-
Drop the Mins_TVC column of the input table onto the
y column of the TV_C table.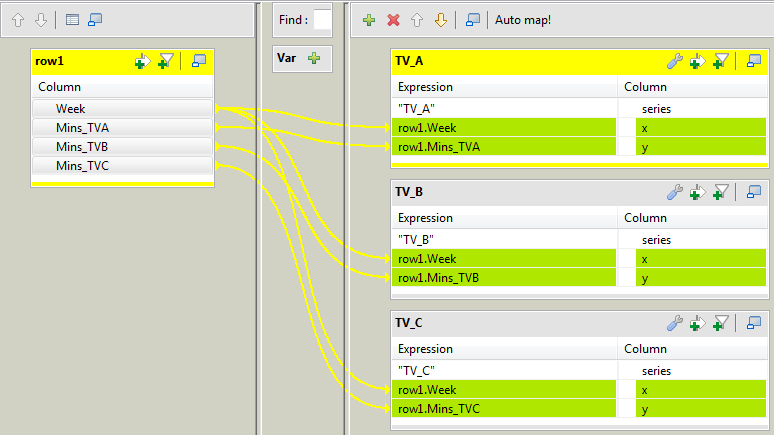
-
Click OK to save the mappings and close
the Map Editor and propagate the output
schemas to the output components.
Document get from Talend https://help.talend.com
Thank you for watching.
Subscribe
Login
0 Comments