Visualizing output data
You can build a bar chart on each of the clusters to visualize the number of
customers grouped by different regions or channels.
Use tHDFSInput and tBarChart components in two Jobs to read the output HDFS
files and generate a bar chart on the data to ease technical
analysis.
files and generate a bar chart on the data to ease technical
analysis.
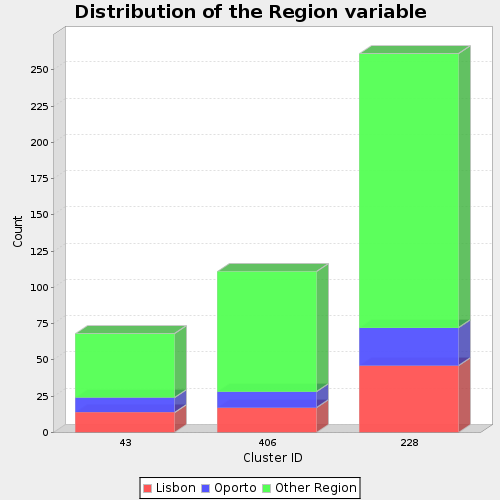
In the first Job, tHDFSInput reads the
region output HDFS file and passes the flow to tBarChart. tBarChart reads
data from the input flow and transforms it into a bar chart in a PNG image
file.
region output HDFS file and passes the flow to tBarChart. tBarChart reads
data from the input flow and transforms it into a bar chart in a PNG image
file.
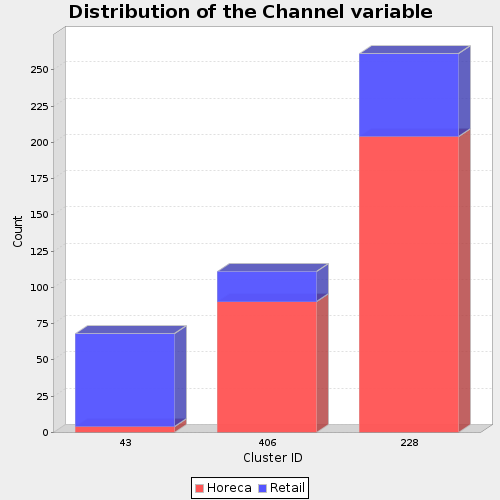
In the second Job, tHDFSInput reads the
channel output HDFS file and passes the flow to tBarChart which transforms the input data into a bar chart
in a PNG image file.
channel output HDFS file and passes the flow to tBarChart which transforms the input data into a bar chart
in a PNG image file.
Each bar chart has three columns, every column represents the number of
records in one cluster.
records in one cluster.
For further information about the tHDFSInput component,
see tHDFSInput and for more information about the
tBarChart, see tBarChart.
see tHDFSInput and for more information about the
tBarChart, see tBarChart.
Document get from Talend https://help.talend.com
Thank you for watching.
Subscribe
Login
0 Comments